
Do you want to use inactive relationships in you reports?
Relationships are very important in Power BI. It’s something similar to joins in SQL. Sometimes you need to join two tables in Power BI using different fields.
For example, you have a table in Power BI with 3 Date columns. And you want to join it with the Dim Date table. But, at the same time, only one of these relationships is active and the others remain as inactive.
So, if you want to do some calculations based on the other relationships, you cannot do it. So, what’s the solution and how you can solve it?
Read this article and the related YouTube video to understand what you can do to use inactive relationships.
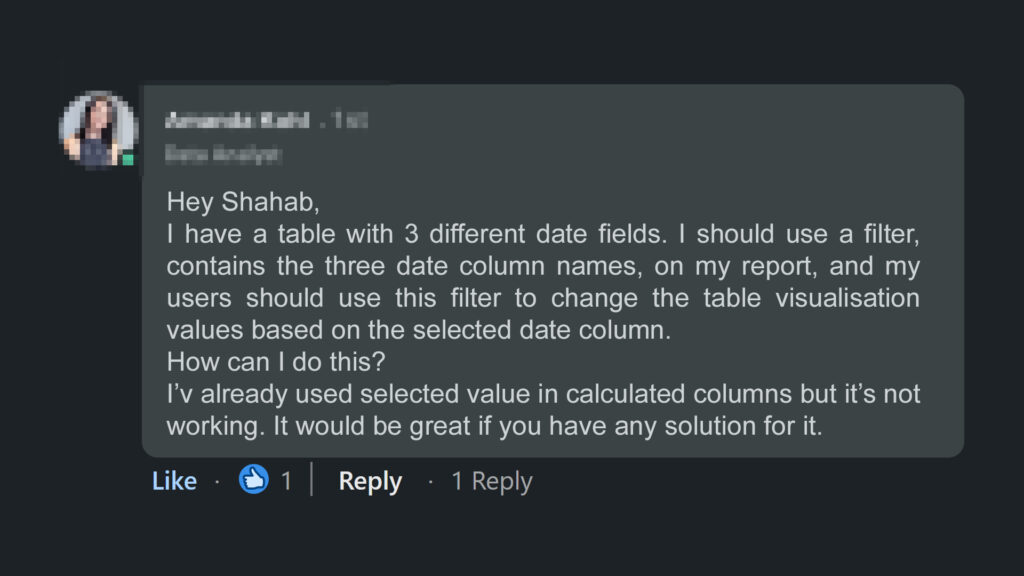
Some days ago, I received a message on my social media account, and one of you asked a question which made a problem on her project. Please read the question below and then I’ll provide the solution in this article.
Don’t forget to subscribe to the YouTube channel, and comment your questions below this article or on YouTube Channel.
Disable Auto Date/Time, Create Dim Date
This is a common problem that many developers face. I previously created a short video about the Power BI best practices for date filed values. There, I mentioned that you should disable Auto Date/Time, create a Dim Date table, and change your dim date as date table.
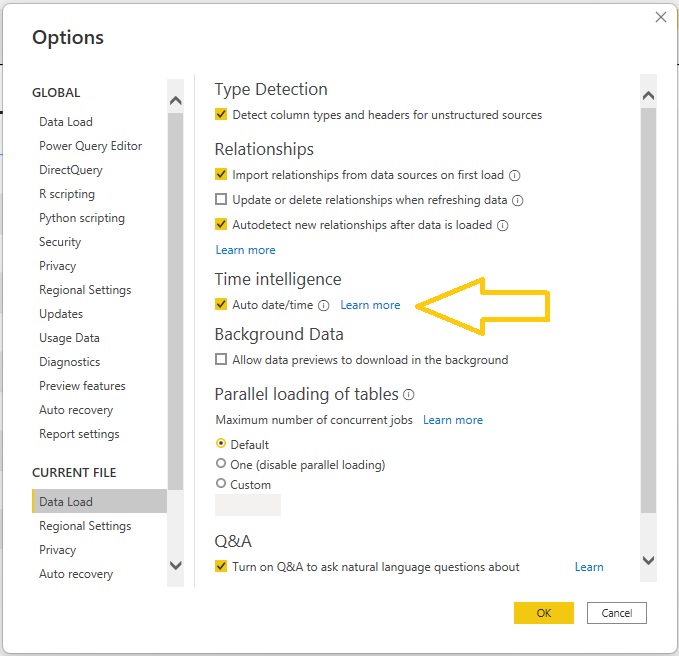
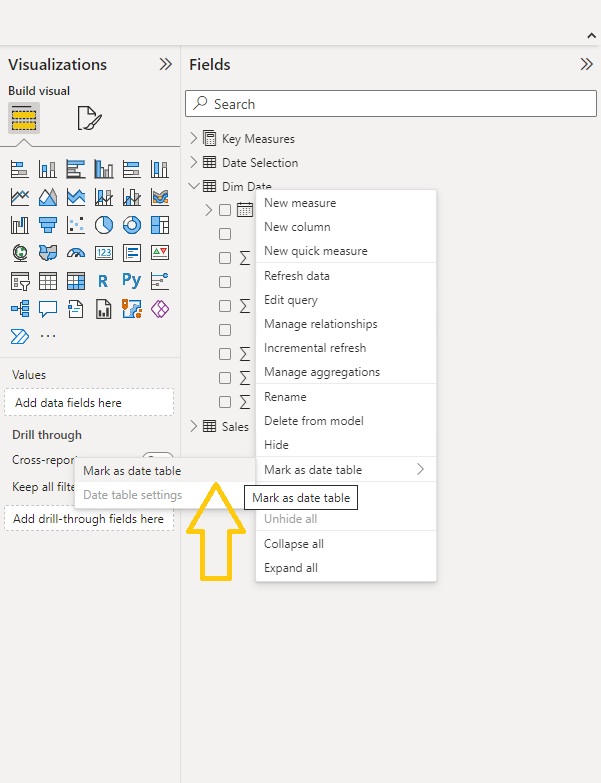
It’s indeed a best practice in Power BI, because otherwise, Power BI creates a date table in the background that you can’t see, and it increase your data model size and decrease your report performance.
Problem Solution
Let’s go back to the question.
The problem usually happens when you have different date columns in your table and when you join it to the dim date table, only one of them is active and the other relationships remain inactive.
So, what is the solution if we need use the other inactive relationships in our report and do some calculations based on them?
Stay with me with an example and you will learn how to solve this issue.
Example
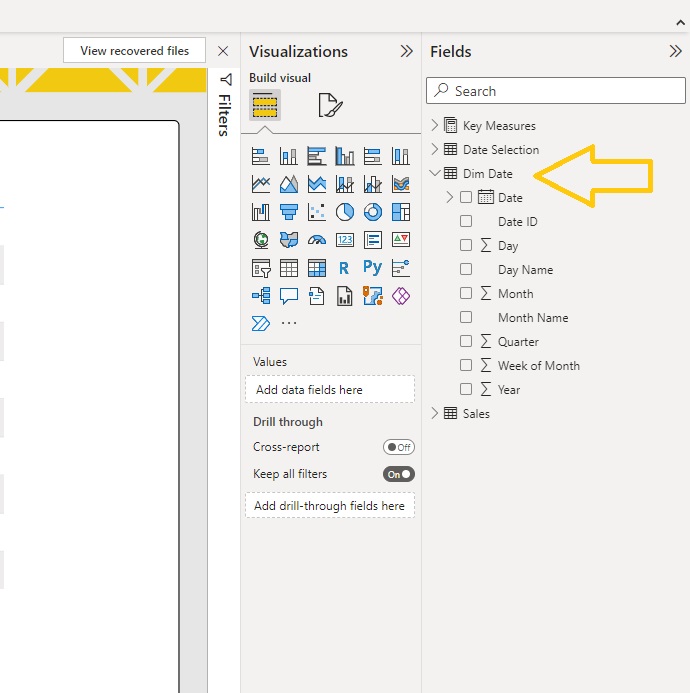
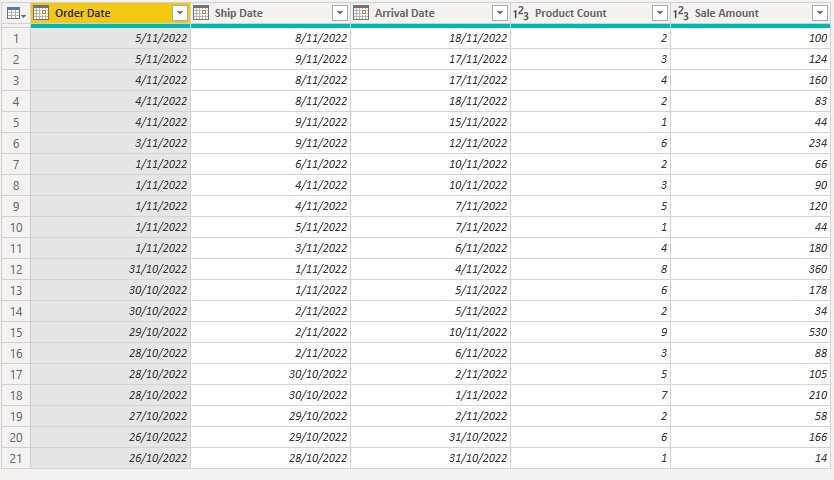
Assume that we have a sales table which contains the number of sold products and sales amount. We also have three different date columns for Order Date, Ship Date, and Arrival Date. It’s a very simple table just for demonstration.
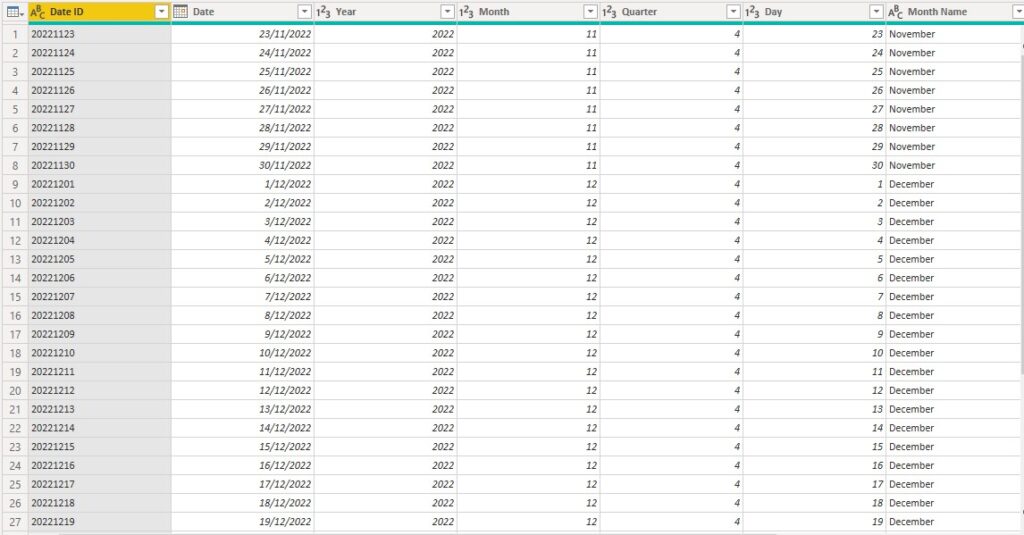
I also created a dim date table and you can read the related article in the blog on how to create a dim date table in Power BI.
So, we want to create a visualisation and slicers which reports the users about our sales.
Modelling Tab
Let’s save and close the Power Query editor, and then go to the modelling tab. Here we can manage the relationships between tables.
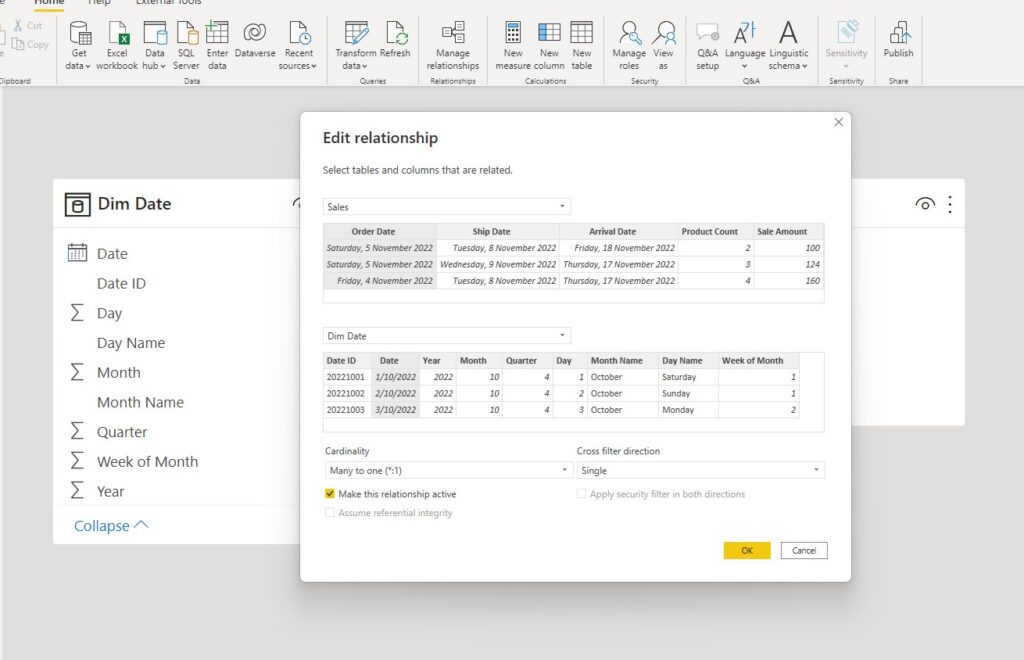
So, click on manage relationships, in the new window, press on New, in the first drop down menu choose the sales table, and in the second one choose the dim date table. Here because we have only 2 tables in our model, when you choose Sales table, Dim Date will be selected automatically for the second one.
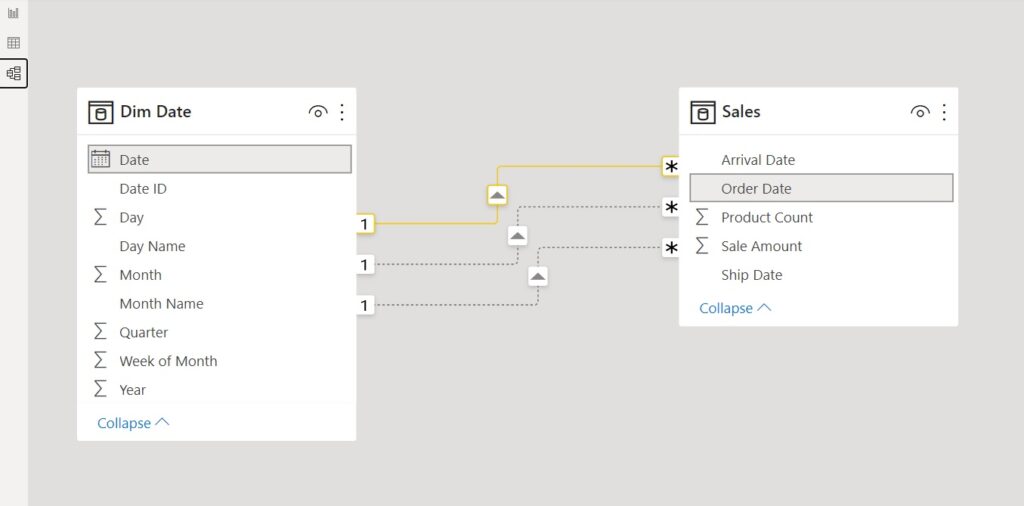
Now, from the Sales table choose Order Date column, as you can see the column colour will be changed. And then, select the date column from Dim Date table. And press OK. Our first relationship created.
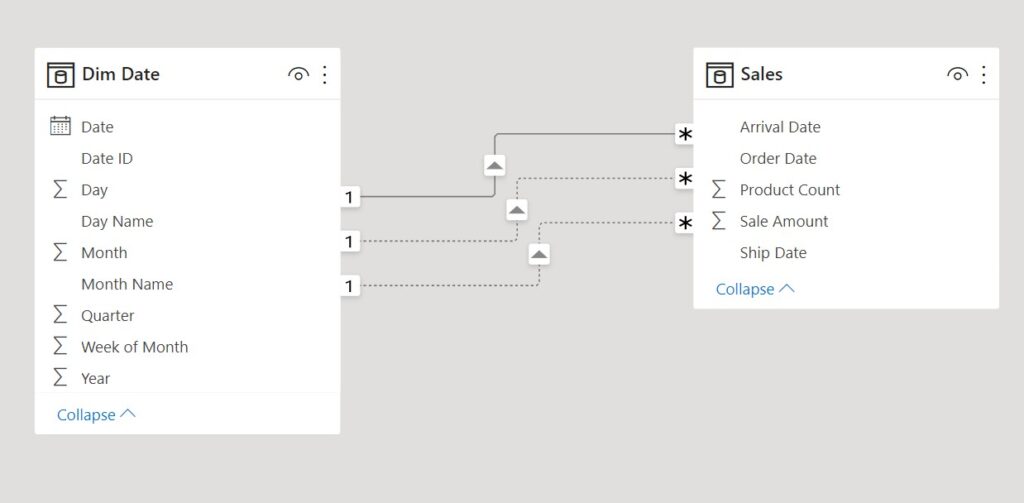
Now, we do the same process for Ship Date and Arrival Date from Sales Table and Date column from Dim Date table.
As you can see, 3 different relationships created. But only one of them shown as a solid line, and the other two are dotted line. What it means?
If you click on Manage Relationship button again, you can see the three relationships there. But only in front of one of them you can see the tick mark.
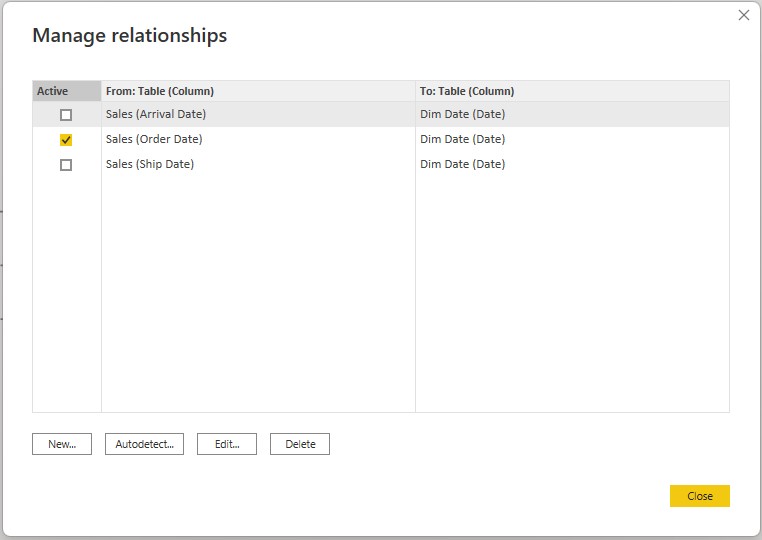
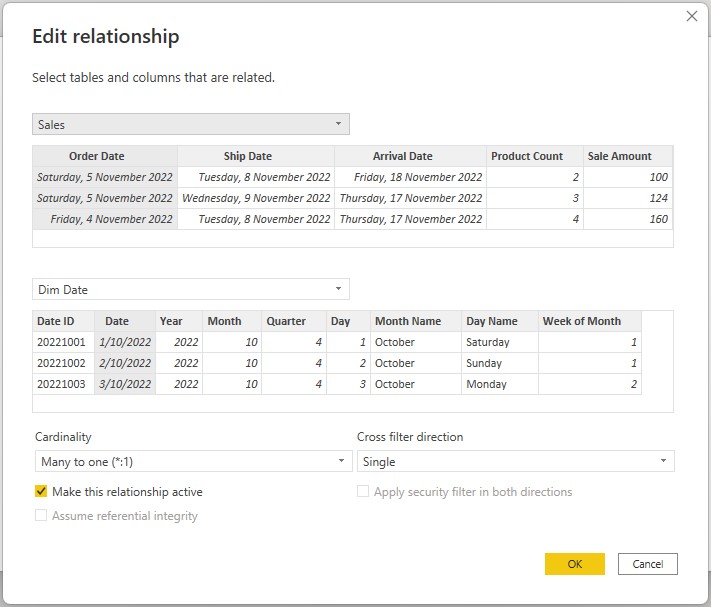
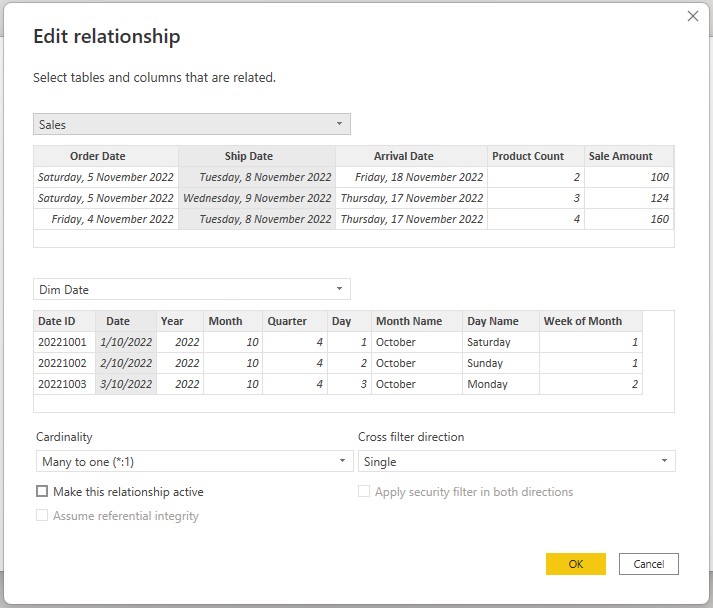
Double click on it to edit. As you can see, at the bottom of this window there is a check box which is enabled for this relationship that shows this relationship is active. If I close this window and open another relationship, you can see the check mark is not selected. This means only one of the relationships is active and the other two are inactive.
This is what Power BI considers for creating a relationship between two tables. It mean you cannot have more than one active relationship between two tables. So, if you have different relationships, one of them will be active and the others remain as inactive.
So, what happens if only one relationship is active?
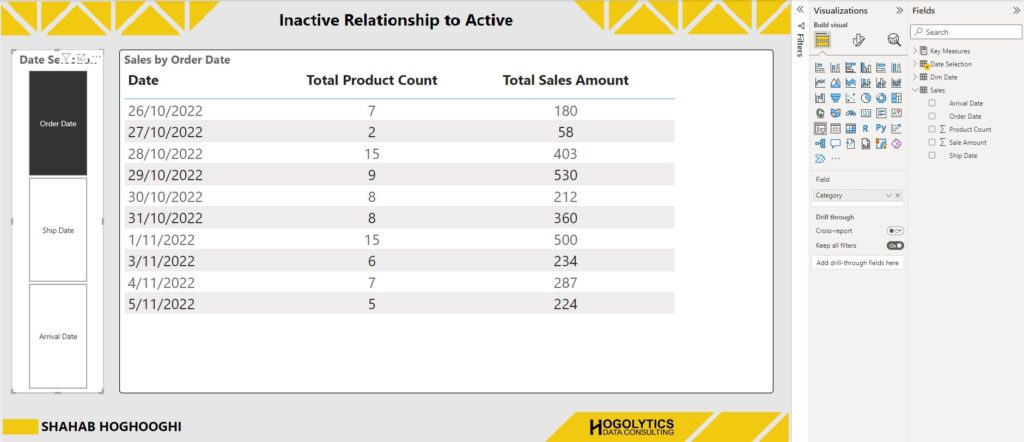
Here in the Report tab, if we create a simple table, and drag the date column from Dim Date table and mark it as a Date, and the Product Count and Sales Amount from Sales table into the table you can see different numbers for different dates.
But what do these numbers show? What Date is being used in Date Column? Order Date? Ship Date? Or Arrival Date? Think for a second!

Correct, the one with active relationship.
If we go back to the modelling tab we can see the Order Date here is active. And these dates shows the number of products and sales amount for each Order Date. You can check it with the initial Sales table.
But can you remember the question raised by one of the followers at the beginning of this article?
She needs to see the data for different date columns. But unfortunately, only one of the Date fields is working! Do you like to know the solution?
Keep Reading!
Measures
Now we want to create a slicer, in which the users can choose one of the three date columns in Sales Table, and then the table changes based on the Order, Ship, or Arrival Date.
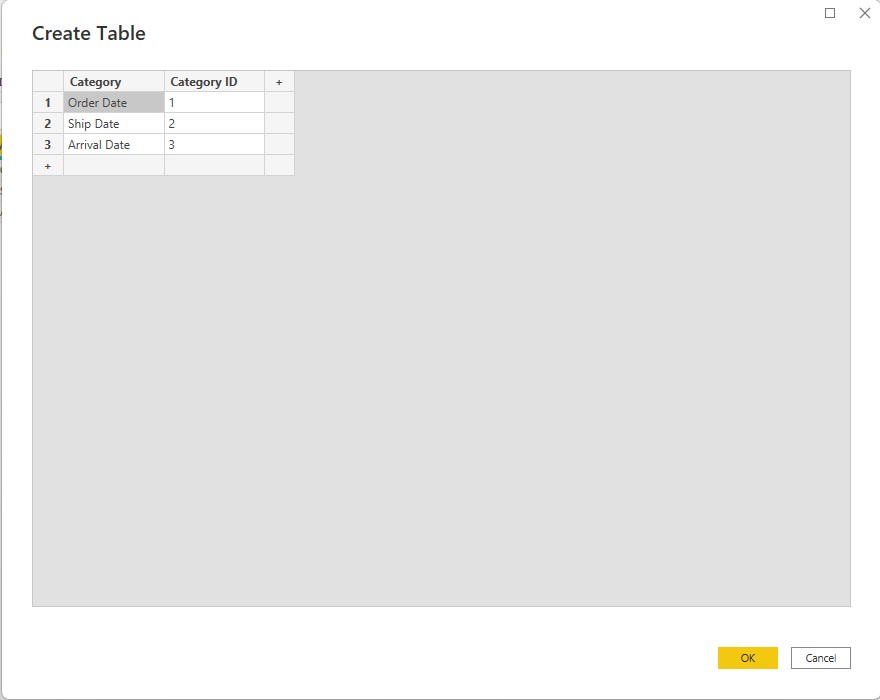
First of all, we should create a Category table, to make the selection in slicer. So, easily create a table, name it as Date Selection, and name the column as Category, insert 3 row data, Order Date, Ship Date, and Arrival Date. And then create another column as Category ID to use for sorting the other column and press Load.
Expand the Date Selection table, choose Category, from the Column tools menu, choose Sort by Column, and select Category ID.
Now create a slicer, resize it, drag the Category field from Date Selection table into it and format the visual.
Please become sure from the visual formatting pane, choose Single select within the Selection section. It allows your users to be able to select only one of the Dates at the moment.
What we’re looking is by clicking on each of these items in Date Selection Slicer, the dates, Product Count, and Sale Amount in table should be changed based on the selected date. But, it’s still not working!
To do this, we should use some measures. First create a simple table without any data, call it as Key Measures. What I’m recommending to do, always have separate field for creating your measures and never create them within your tables. It helps to have a clean and organised model, and anyone opens your Power BI file easily can understand it.
Go to the Key Measures Table, from the Table tools menu, choose New Measure and write this measure to calculate the total number of Product Count. Name it as Sales Count Order Date. As you know because the relationship for Order Date is active, this calculation will be applied only for the Order Date.
Sales Count Order Date = SUM(Sales[Product Count])
Now you can remove the empty column from Key Measure table, and you can see the Key Measure table icon changed to a calculator which shows this field contains measures.
Create the second measure as Sales Amount Order Date which is equal to Sum of Sale Amount in the Sales Table.
Sales Amount Order Date = SUM(Sales[Sale Amount])
Now it’s the time to create measures for other two dates and change the relationships. So, we create 4 measures one by one:
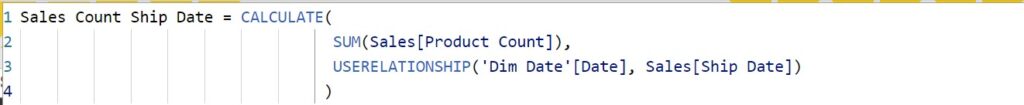
The first one is Sales Count Ship Date.
Sales Count Ship Date = CALCULATE(
				                  SUM(Sales[Product Count]),
				                  USERELATIONSHIP('Dim Date'[Date], Sales[Ship Date])
				                 )
We should do the same for Sales Amount Ship Date, Sales Count Arrival Date, and Sales Amount Arrival Date.
Sales Amount Ship Date = CALCULATE(
				                  SUM(Sales[Sale Amount]),
				                  USERELATIONSHIP('Dim Date'[Date], Sales[Ship Date])
				                 )
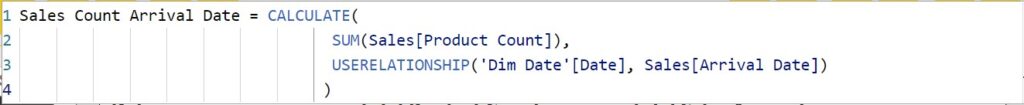
Sales Count Arrival Date = CALCULATE(
				                  SUM(Sales[Product Count]),
				                  USERELATIONSHIP('Dim Date'[Date], Sales[Arrival Date])
				                 )
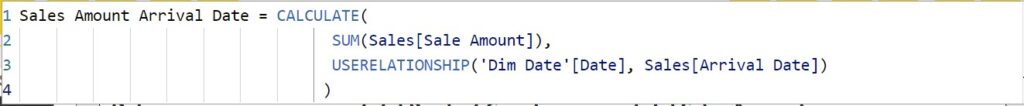
Sales Amount Arrival Date = CALCULATE(
				                  SUM(Sales[Sale Amount]),
				                  USERELATIONSHIP('Dim Date'[Date], Sales[Arrival Date])
				                 )
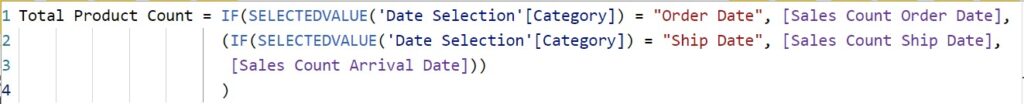
Now we have all the required relationships. Next, we need to write two other DAX expressions which give us the count of products and sales amount based on the selected Date from the category in the slicer.
So, we write:
Total Product Count = IF(SELECTEDVALUE('Date Selection'[Category]) = "Order Date", [Sales Count Order Date],
                      (IF(SELECTEDVALUE('Date Selection'[Category]) = "Ship Date", [Sales Count Ship Date],
                       [Sales Count Arrival Date]))
                      )
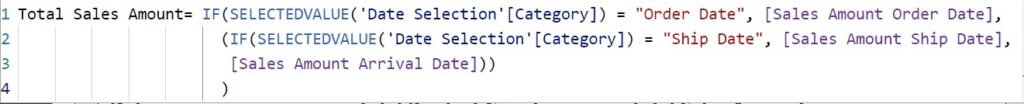
Then we write this DAX expression the same as the last one to extracts the Total Sales Amount.
Total Product Count = IF(SELECTEDVALUE('Date Selection'[Category]) = "Order Date", [Sales Count Order Date],
                      (IF(SELECTEDVALUE('Date Selection'[Category]) = "Ship Date", [Sales Count Ship Date],
                       [Sales Count Arrival Date]))
                      )
Now, remove the [Product Count] and [Sale Amount] from the table on canvas and instead add [Total Product Count] and [Total Sales Amount] and format the table.
Table Title
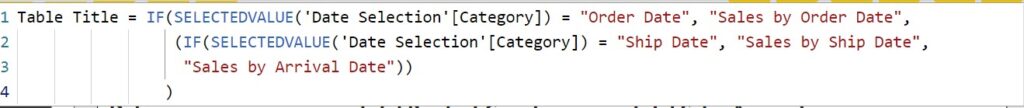
To create a title for the table we can also write this DAX expression:
Table Title = IF(SELECTEDVALUE('Date Selection'[Category]) = "Order Date", "Sales by Order Date",
                 (IF(SELECTEDVALUE('Date Selection'[Category]) = "Ship Date", "Sales by Ship Date",
                  "Sales by Arrival Date"))
                )
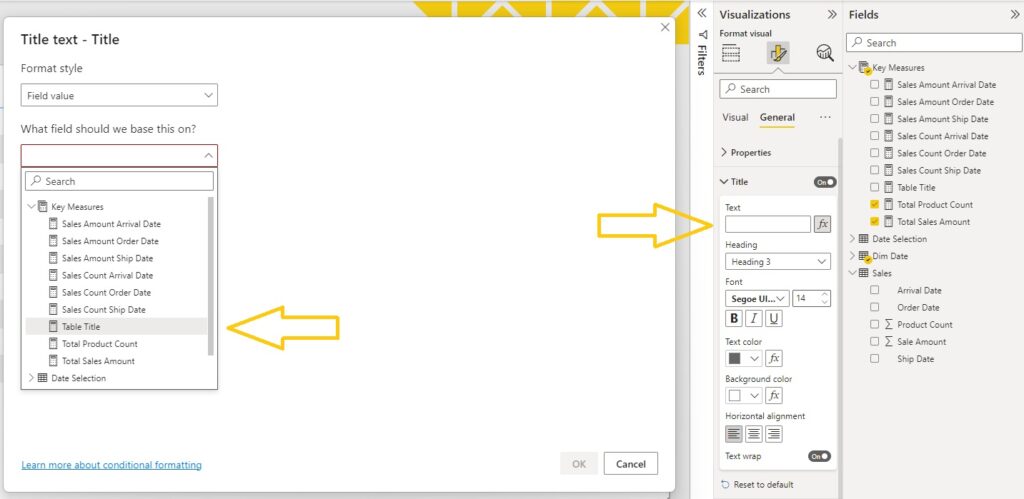
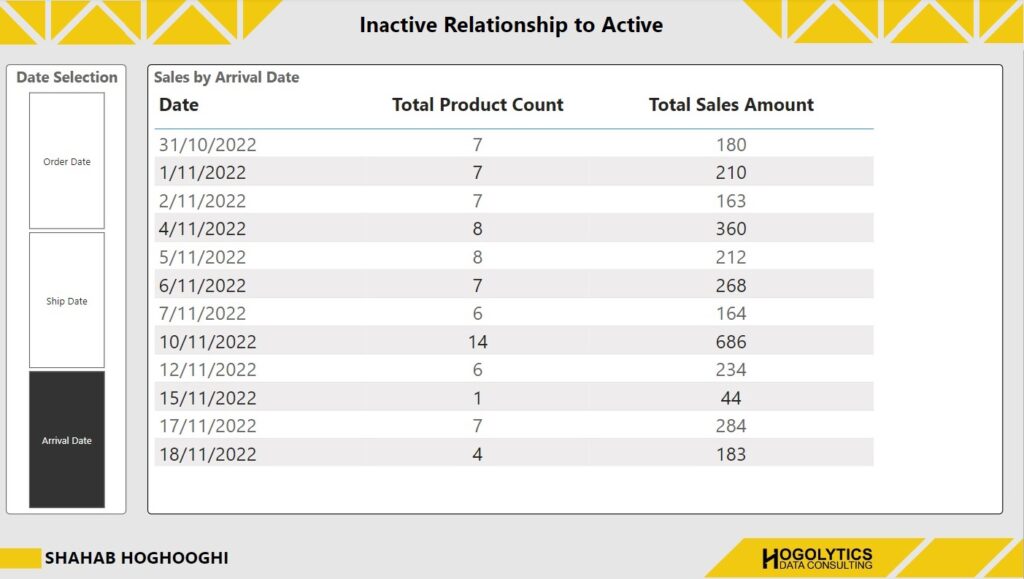
Now click on table, go to general formatting, expand the title section and turn on the toggle. Go to text, click on fx button. Choose filed value and then Table title measure created in the last step. And finally, format size, font and colour.
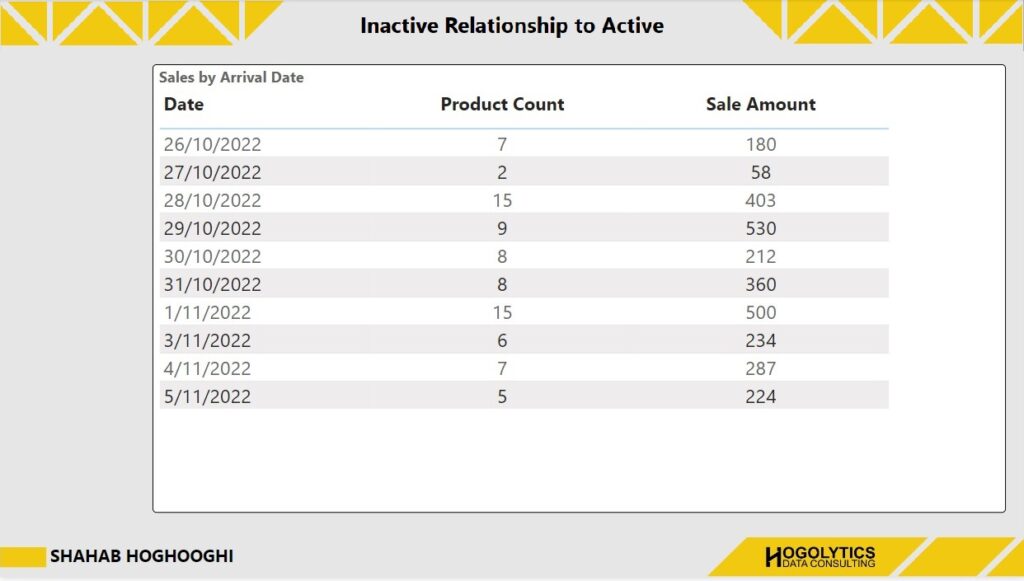
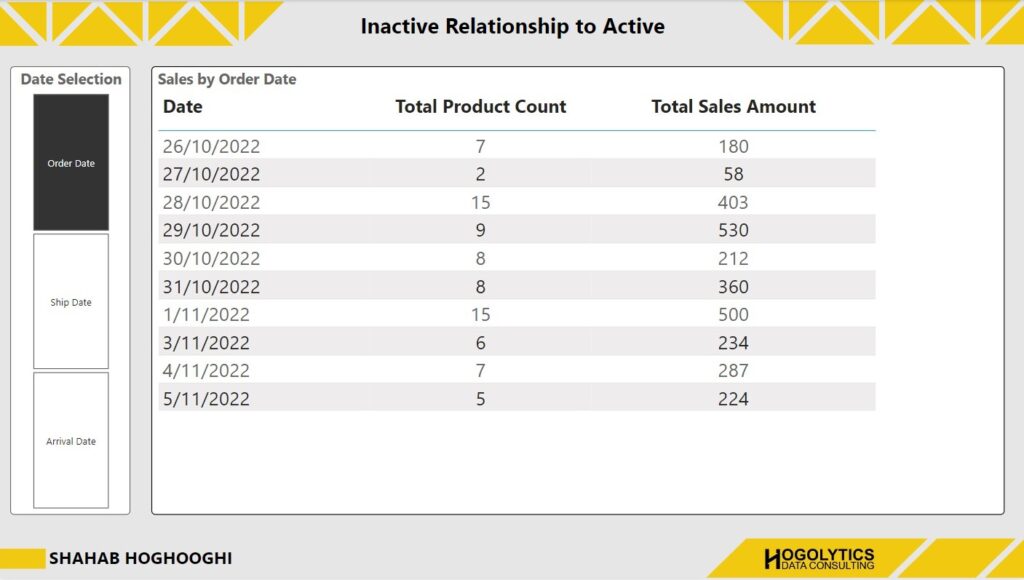
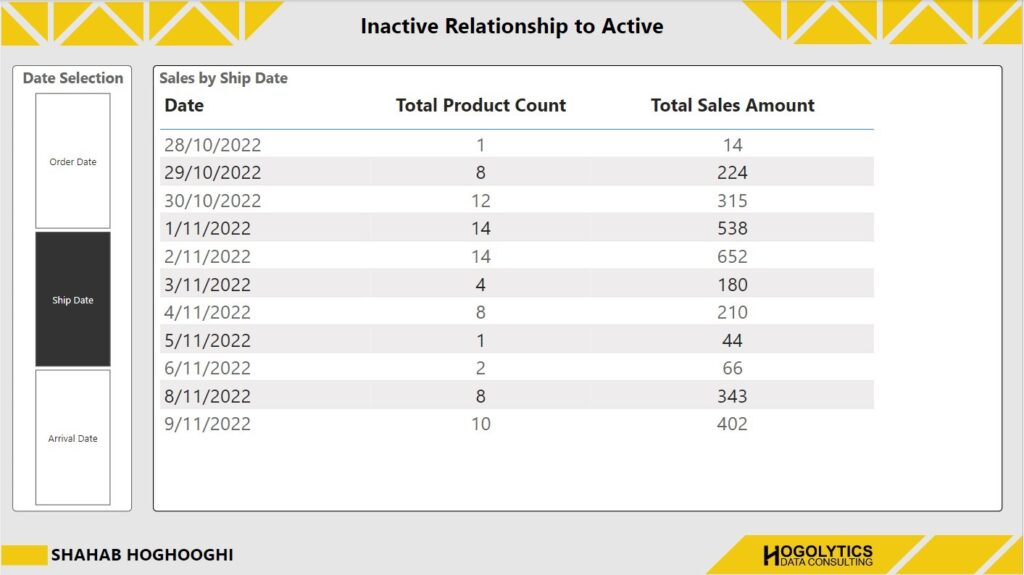
Now if you select any of the categories from the slicer, the dates and numbers will be changed based on these values and you can see the title of the table show the data is related to which Date field.
Hope you enjoyed this Power BI post. You can also comment your question below this article or on YouTube Channel, and I’ll try to answer all them as soon as possible in the next upcoming articles.