
Do you like to know how Power BI report users can extract the Data behind Visuals into a CSV file just by pressing a button?
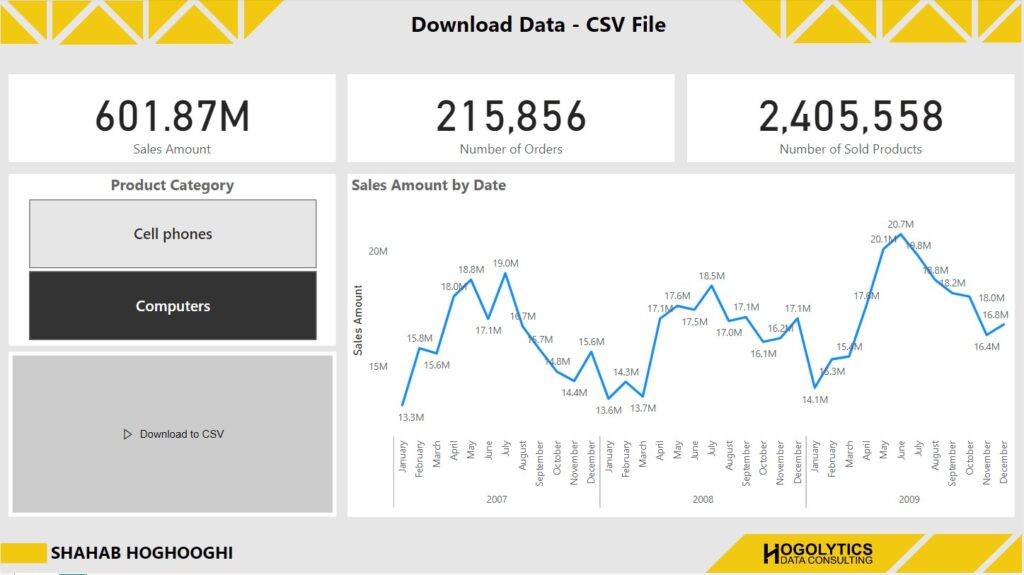
Imagine that we have a report like this one. As you can see, this Line graph shows sales information for two product categories. I also created a slicer which helps me to slice and dice this visual.
You can also see a button here, and if I press on it, the data will be saved into a CSV file.
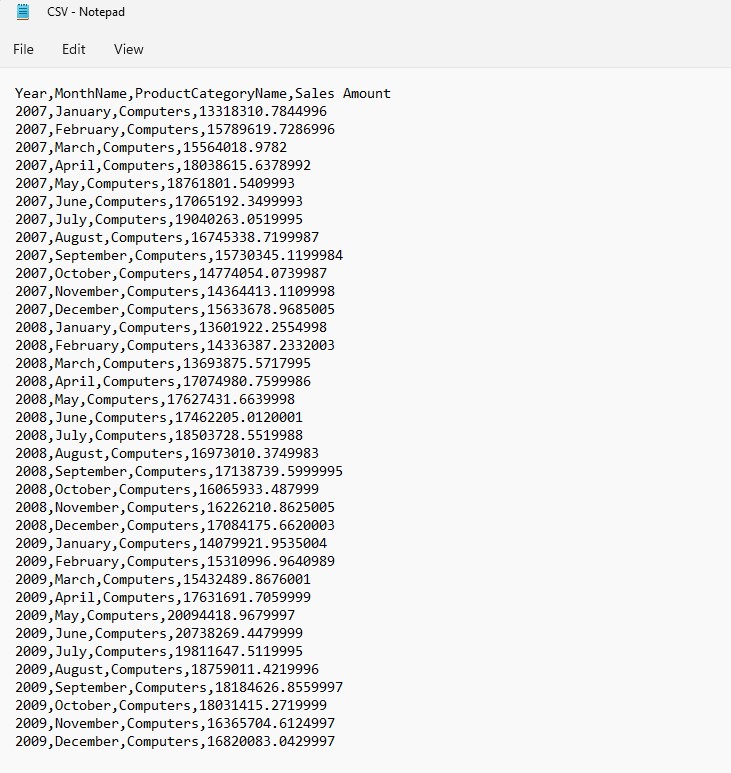
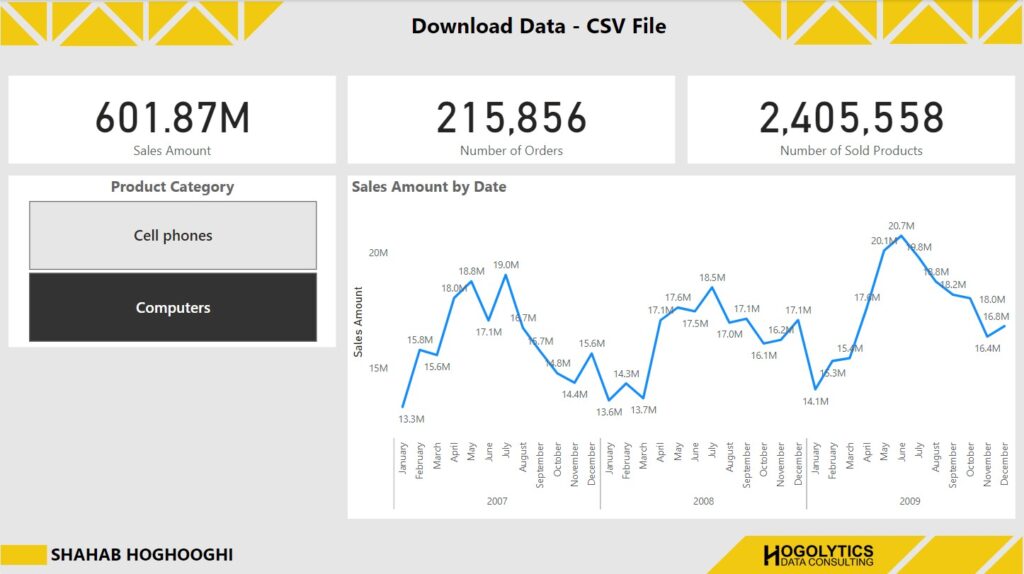
For example, I’m changing the slicer for Computers, and then press the CSV button. When I go to the defined destination on One Drive, you can see the CSV file here, and If I open it, you can see the Sales Data for Computers’ Category.
How to Download Data into a CSV file?
Let’s see how we can do this!
I just start from the scratch and show you how you can create a button to download the data in forms of a CSV file.
We have the same visual here which shows the Sales amount within a time period. We can also use the slicer to change the category.
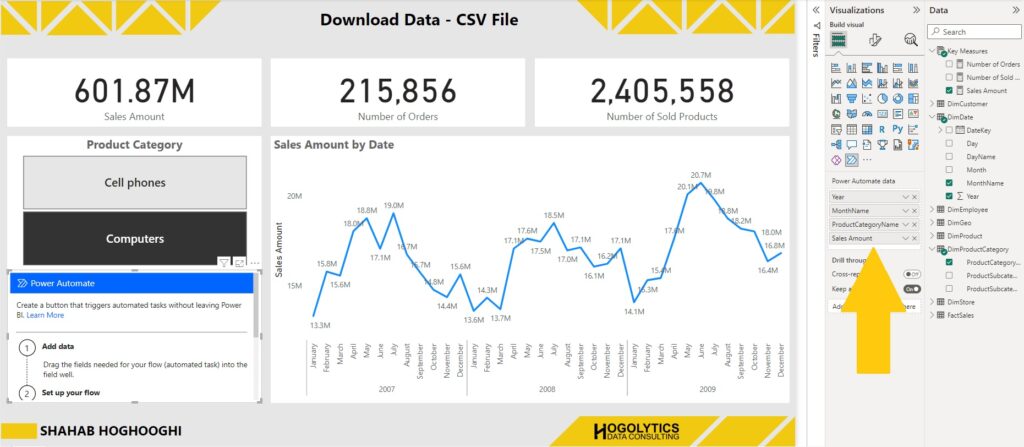
Now to create a button, we should use Power Automate. Let’s choose Power Automate visual from the visualisation pane.
Next, we should see what data we are using in the line graph. So, here we have Year, MonthName, Product Category Name, and Sales Amount. In next step, we exactly drag and drop these fields into the Power Automate data field.
Create Flow
Then, we click on the 3 dots on top right side of the Power Automate visual, and choose edit.
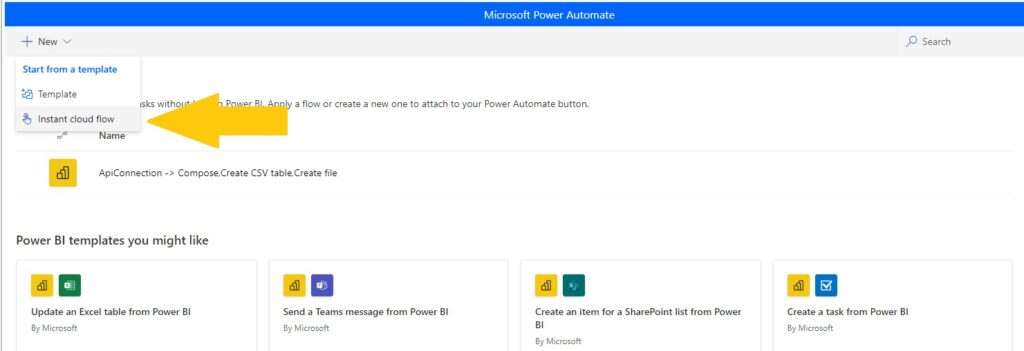
Now, it’s the time to create a flow for saving data into the CSV file. First, I create a new Instant Cloud Flow.
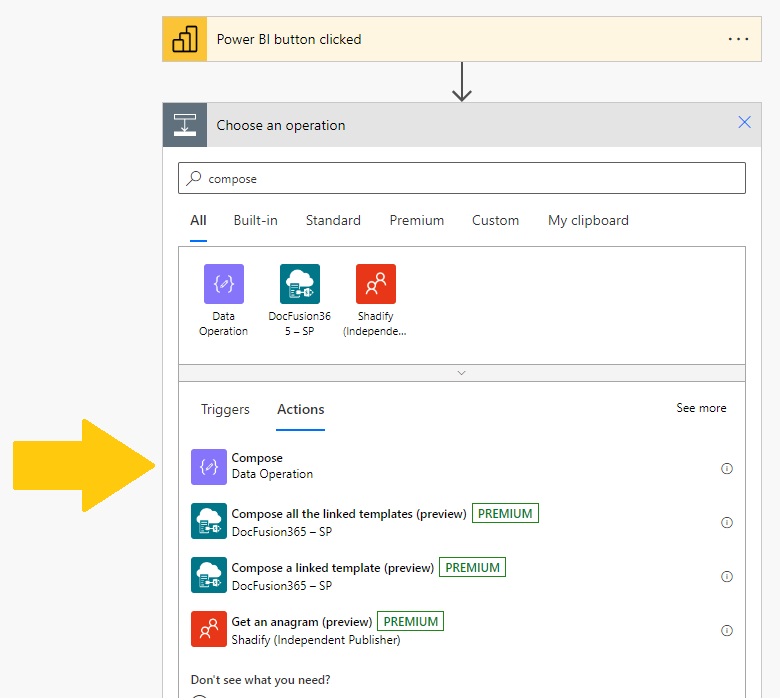
After adding a step search for “Compose” and select this option. We use it in the first step to get the data.
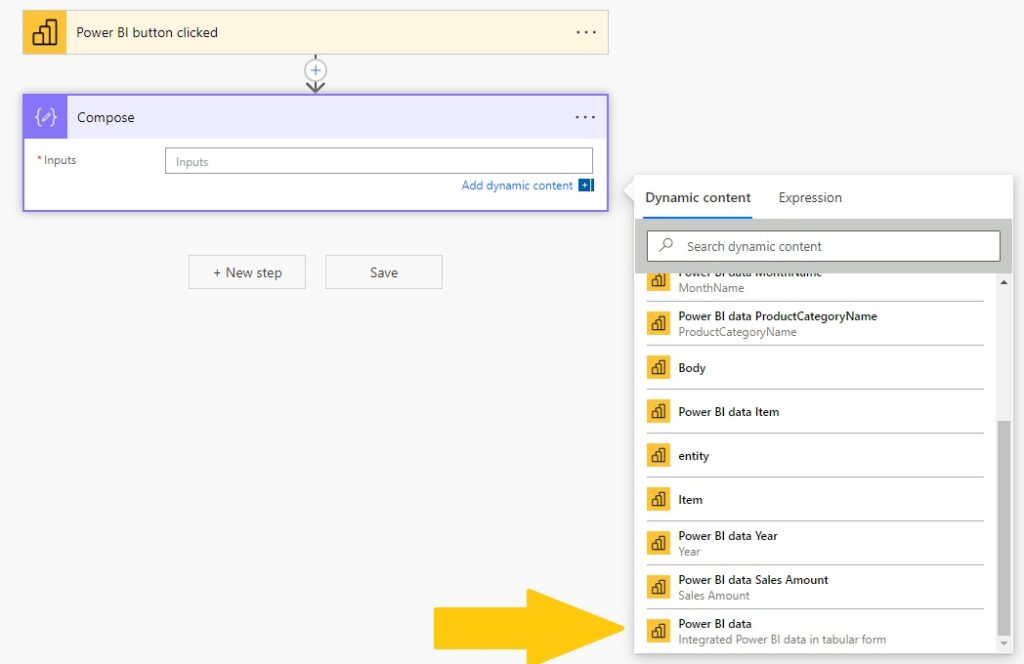
Then, in the search field we should choose “Power BI data”.
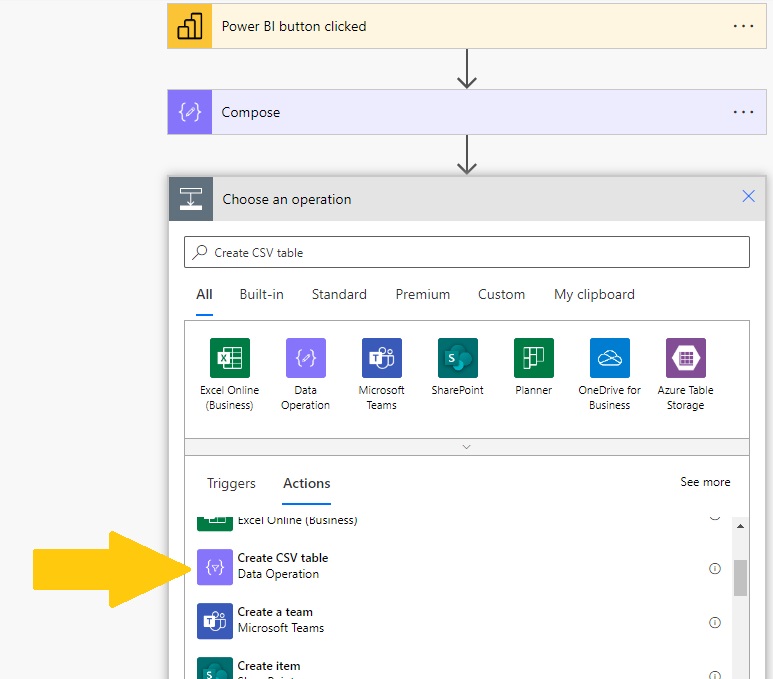
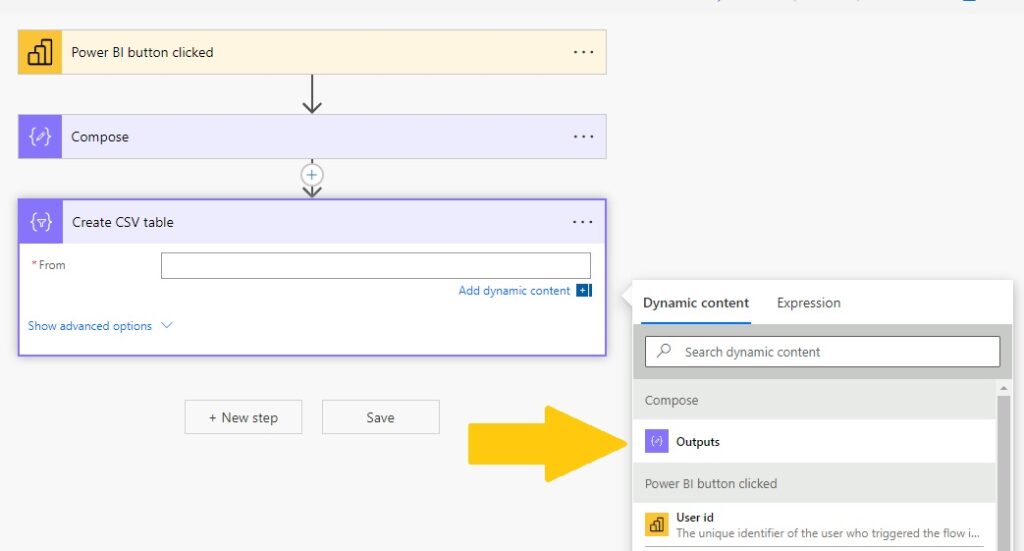
Now We should add a new step, and search for “Create CSV table”.
In front of the “From” field, choose the Outputs. And then, add a new step.
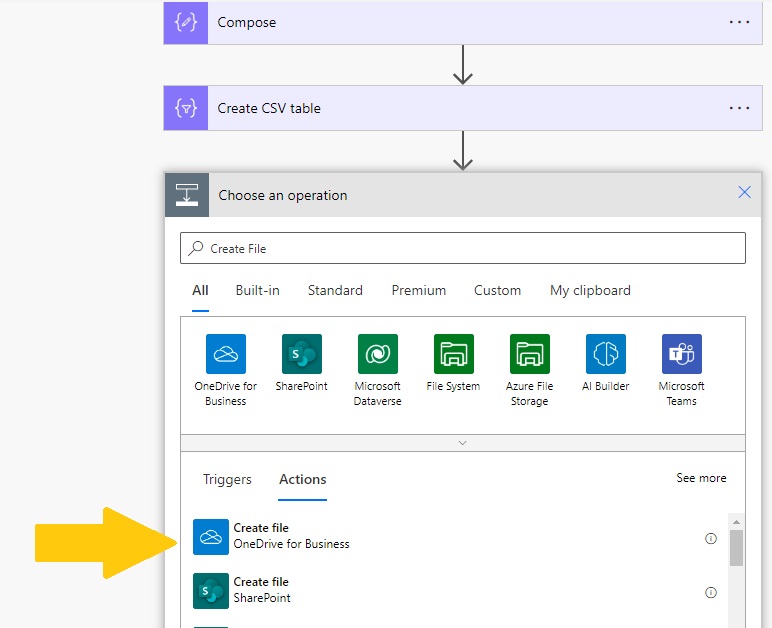
Search for “Create file” and choose this one. And in the fields select the destination folder and then enter the file name. And in the content field choose Output.
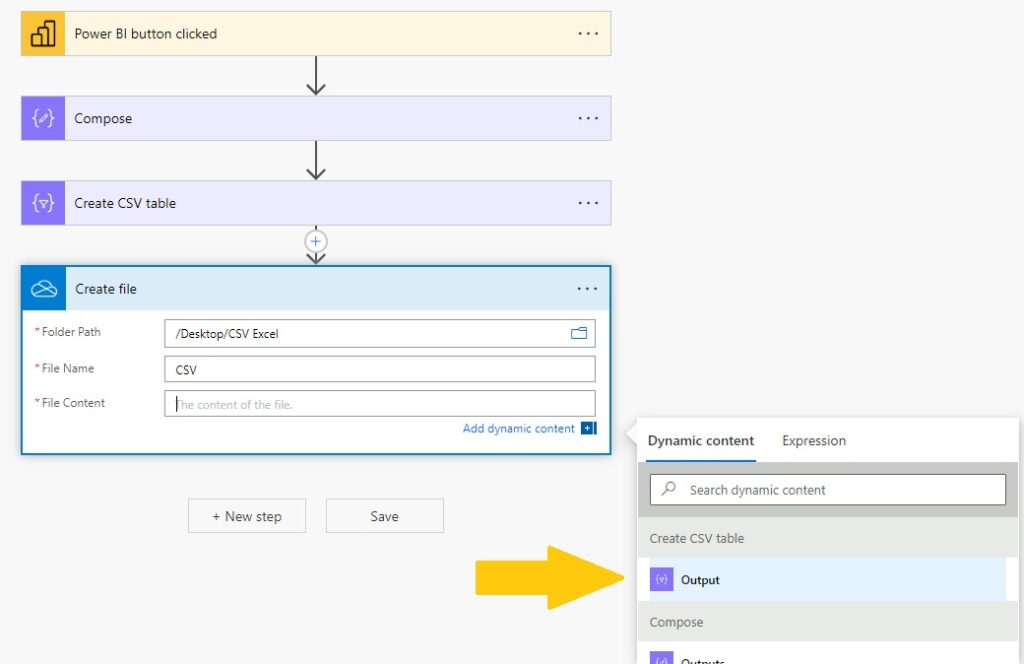
Then Save, And again Save and apply. And go back to the report.
Now, if I press on the button, after some seconds it shows triggered.
You probably have to wait for some seconds in order to recreate the whole CSV file. This time can be vary based on your data size.
Now you can go to your destination folder and easily download the CSV file and open it in any tool like Notepad.
Final Word
If you enjoyed this post and the related video on YouTube, please put your comments and follow the YouTube channel. I’m always happy to answer all your questions.