Many of you may rarely use Bookmarks in your reports, or you may think it’s so challenging to be implemented in your reports. I highly recommend you to watch the tutorial on Hogolytics YouTube channel beside this blog. It can help you to understand Then, you’ll love it and understand how easy and powerful it is. Are you ready to launch the rocket? Let’s go!
What is Bookmark in Power BI?
Microsoft defines it as “A bookmark captures the state of a report page. This includes the settings you’ve made to filters, slicers, and visuals on that page.”
You can read more here.
In a nutshell, bookmark works like when you screenshot of your report page, which saves the filters, slicers, cross-highlighted visuals, sort order and so on and so forth that you used in your report. When other users view your report, they can get back to that exact state by selecting the bookmark you saved.
We can do many different things using bookmarks. For example, we can swap a visual with another one. We can use it to create information panel or slicer panel. We can create buttons and filters, and many many more using bookmarks. The combination of bookmarks, buttons and selection can help us to improve our reports to the next level.
Where to find bookmark?
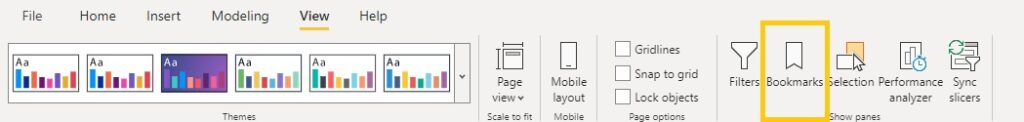
To begin you need to open bookmark pane. Go to the “View” tab, and then from the “Show panes” section, select “Bookmarks”.
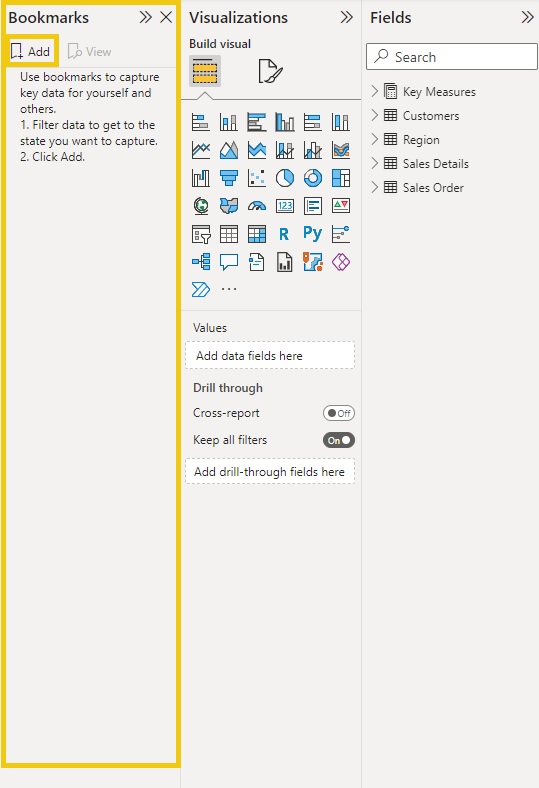
In the Bookmarks panel, press on Add button to create the first bookmark.
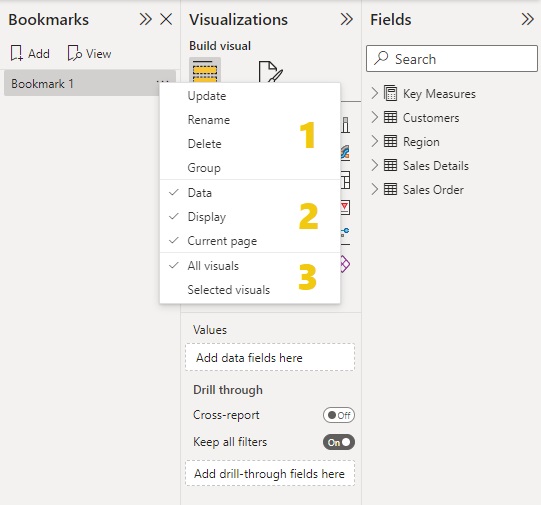
Once the bookmark created you can see 3 dots. When you left click on it, some options will appear for you. These options are divided to 3 different categories. You can see a line between each of these categories.
Options in category 1 represent the functions you can apply on the bookmark. Each time you can press on one of them and it will be applied to the bookmark.
I call the options in category 2 as Application options, which enable you to apply different functionalities on the visuals. You can choose either 1, 2, or all the options.
And the 3rd category contains the selections. You can only use one of the options in this category.
Let me explain more. You can find different options in each of these categories.
Category 1
Update: This option updates the state in which bookmarks should be applied.
Rename: You can use rename option to change the name of each bookmark.
Delete: This option removes the bookmark.
Group: Using this option you can group some bookmarks into one group for better visibility and ease of use.
Category 2
Data: This option helps you to save data for any of the properties such as filters and slicers.
Display: In the Selection pane you can hide or unhide different visuals. Display option helps you to apply the rules you defined for hidden or unhidden visuals. It means that if Display option is on, then the hidden visuals will stay hidden if you use the bookmark.
Current Page: This option helps you to navigate to the page in which the bookmark originally created.
Category 3
All Visuals: This option helps you to apply the bookmark to all visuals in the page.
Selected Visuals: This option helps you to apply the bookmark to the selected visuals in the page. After selecting this option, you should select the visuals you want to apply the bookmark, and then, update the bookmark.
It may be a little bit confusing at the first glance. If you watch the video in YouTube channel it will be more understandable. But don’t worry. I’ll explain more here with examples, and it will become clear for you.
Before starting it’s good to know mostly bookmarks are being used with the selection together. So, in the examples when it’s required, I’ll show you how to use them together.
The first thing you should do is saving the bookmark whenever you set it to apply different functions. So, before doing anything else or going to another page, you must save the snapshot you created. But, how?
Just click on the 3 dots in front of the bookmark name and choose “Update”. Then the snapshot of all you applied will be saved in the bookmark.
As previously mentioned, you can select all visuals or some of them by switching between “All Visuals” and “Selected Visuals” in the category 3.
Category 2 contains 3 options, “Data”, “Display”, and “Current Page”. You can choose 1, 2 or all these options.
Let me explain more each of them and then, will talk about what happens when each of these options enabled or disabled.
Data option:
When you enable Data option, the bookmark will save:
- Filters (Including the filter pane)
- Slicers (including slicers type, e.g., dropdown or list)
- Visual selection state (such as cross-highlight filters)
- Sort order
- Drill down
- Cross filtering between visuals
Display option:
When you enable Display option, the bookmark will save:
- Visibility of visuals (If Display is not ticked, the bookmark cannot hide/unhide visuals)
- Visuals spotlight
Current Page option:
When you enable Current Page option, the bookmark will save:
- Navigation to the page bookmark applied
What happens when Data enabled/disabled?
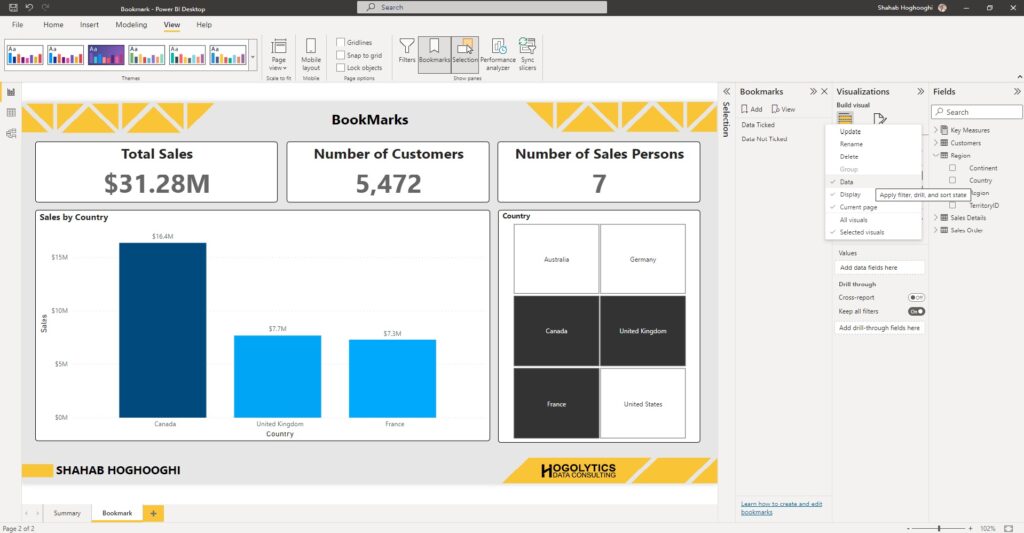
I will explain this topic with an example. Imagine you have a report like the below one, which shows you sales in different countries. There is a slicer available in this page and you can filter the report based on the selected countries.
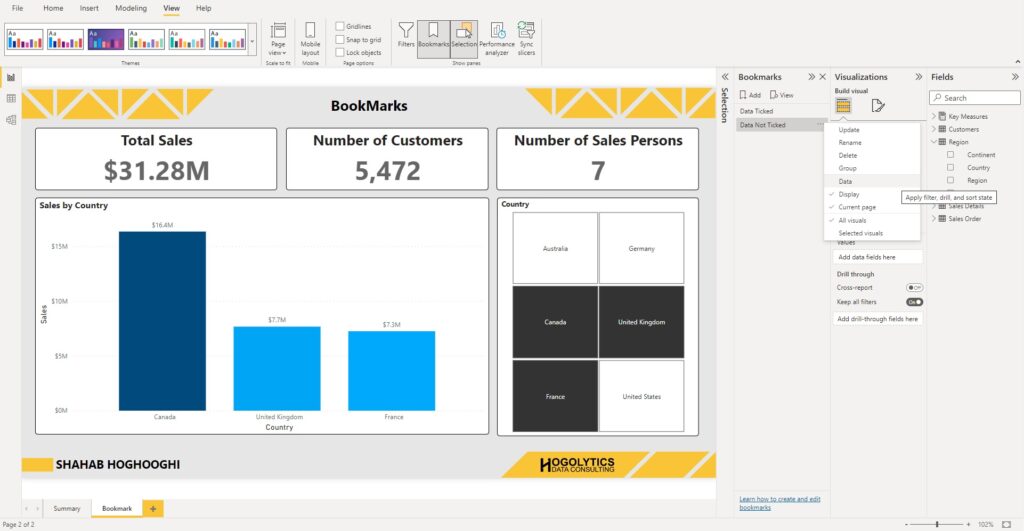
Here I created two bookmarks. I called the first bookmark as “Data Ticked” and enabled the Data tick marks in the 2nd category options, and the second bookmark “Data Not Ticked” and disabled the Data tick mark in the 2nd category option.
First, I selected Canada, UK, and France in the slicer pan, and then updated the bookmarks.
Now, if I change the slicer filter and choose United States and Australia, the report will be filtered based on these countries.
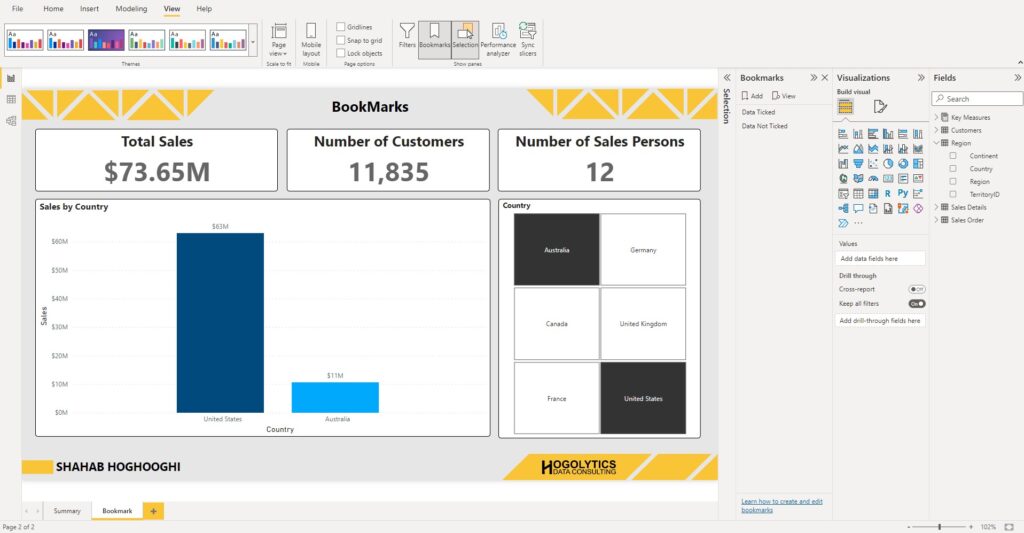
What will happen if I press each of the two bookmarks?
Most of you should answer correct!
If you press on “Data Not Ticked” bookmark nothing happens, because it doesn’t save any slicing data, but if you press “Data Ticked” The report again will be filtered for Canada, UK, and France. Yeeeeeeeep! The bookmark saved your settings.
Challenge:
This time change the sort order of the data in column graph and update the bookmarks. Let me know what happens if you do that. Tell me your answers in the comments!
What happens when Display enabled/disabled?
First functionality:
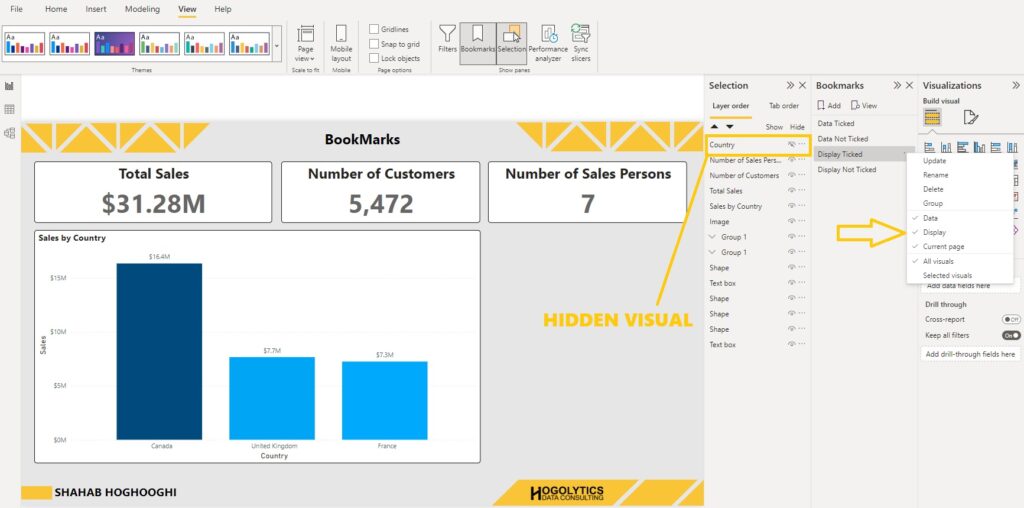
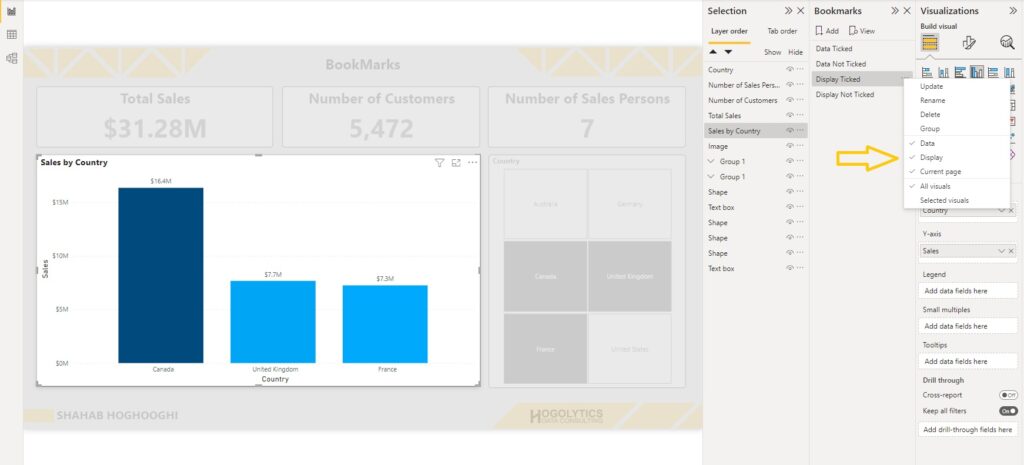
The first functionality of Display option is the visibility of visuals. When the Display option is enabled, it will remember which of the visuals and elements in the report are visible and which are hidden. But when we disable the Display option, then it cannot remember to hide or unhide which visuals and nothing will happened.
Second functionality:
And the second functionality as discussed is the impact of bookmark on the visuals spotlight. When you activate the spotlight for a visual, all the other visuals will be grayed out and the selected visual becomes clear.
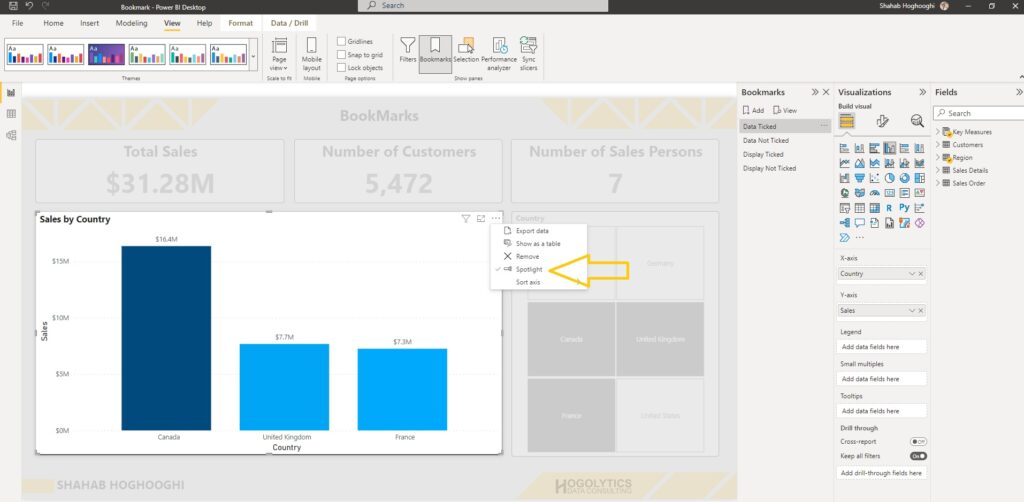
Now we create a Bookmark in which the display is active, spotlight a visual and update the bookmark. Whenever we press the Bookmark “Display Ticked”, then the spotlight get activated. On the other hand, if the Display Option is not ticked, nothing happened to show or not show the spotlight.
What happens when Current Page enabled/disabled?
Now let’s explore the “Current Page” option. When you have several pages in your report, and you apply a bookmark on one of your pages, then you have an option to tick the Current Page option or leave it as unchecked. If you enable this option and update the bookmark, by pressing the bookmark, it doesn’t matter in which page you are. The bookmark will navigate you to the page bookmark is created. But if you don’t check the Current Page option and you are in other pages, by clicking on the bookmark nothing happens and you will stay on the previous page.

This is an overall about what you can do with bookmarks. There are a lot more thing you can do with bookmarks. Please follow the blog and YouTube channel and in the next tutorials I will teach you how to use bookmarks for different purposes, like buttons or creating slicers pane. These topics are very interesting and useful and you will definitely use them in your reports again and again. So, follow me for the next upcoming tutorials.
Your idea is magnificent