
Drill through is one of the most useful features available in Power BI which helps you to see the details behind your visuals. Please read the article completely to understand how to use and apply it. You can also watch the video on YouTube channel for better understanding.
Example
Let’s have this example.
Consider that you’re presenting a report about your clients company sales amount during the time.

Then, your manager asks, could you please provide me the information about the September 2014 which we has a significant decrease in our sale? I want to see the details by each salesperson to understand if someones performance affected the sales amount. Would you please provide me more details?
If you use Excel or just some static graphs, then you probably have to say, ummmm, will be back to you soon. Then you should go, search the database, retrieve the information again, print or save them on an another excel file to show the details to your manager.
But you’re so lucky if you’re using Power BI to present your data. You can already implement the drill through option in your report to show the details about your visuals. All you need to do is to choose the category, and then drill through to the page you created earlier, and present your data!
Then you can see the details for the particular Sales Person and make the appropriate decision to solve the issues and recover the low sales amount!
Whatever your manager need is achievable just by some simple clicks!
Let’s dive in!
How to?
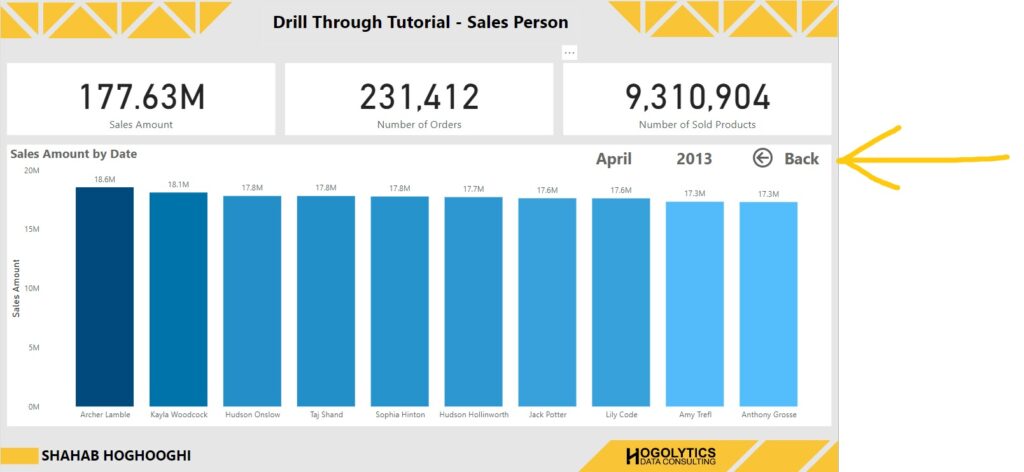
Assume that we have a simple report here in Power BI that shows us the information about the Numbers of Orders, Sold Product Numbers and Sales Amount. In the line graph I used Sales Amount on the Y-axis and a date hierarchy, including year and month name, on the x-axis.
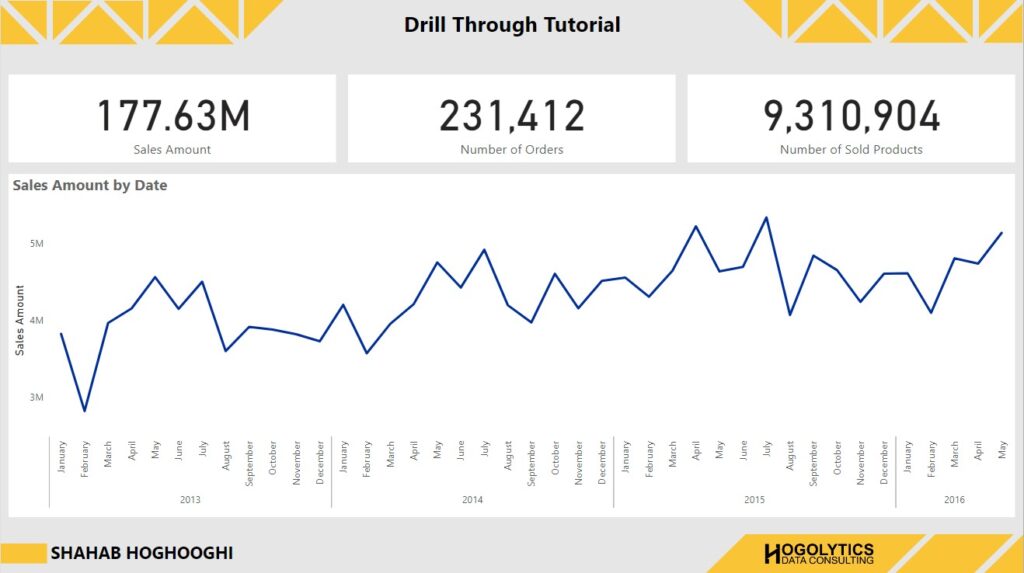
So, you can see the changes in time. But, what we’re looking for here is looking at Sales Persons performance. And also, see who are the customers for each Sales Person!
To do this, I can set separate detailed pages and connect to this report page.
This feature is called as drill through. But how can I do that?
At the first glance you may notice the Drill through here, and you will say easy peasy! But, no, it’s not.
In the first step, you should create a new page from here, at the bottom of the report. I’ll call it as Sales Person. This page serves the details about employees performance. You can decide what type of visuals or information to put in this page!
You can press on the + button and create the new page, and then start building it.
Add three card visualisation at top of the page the same as the first page, and a column graph below it. Then, add the Sales Amount measure to the Y-Axis field and the FullName from Dim Employee table to the X-axis.
Also, add two card visualisation and drag Month Name and Year into them and format the. Then, you can have a page like below.
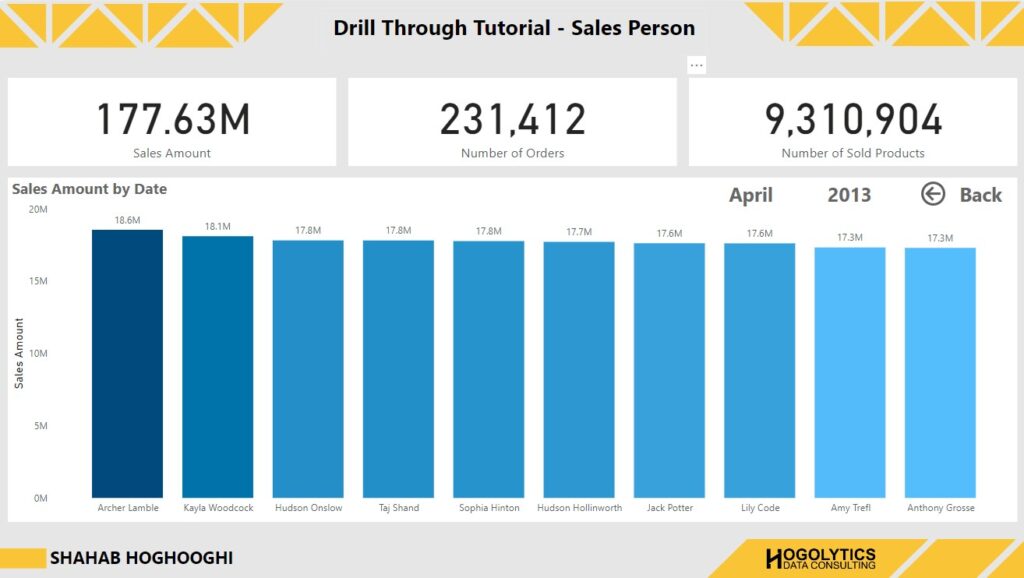
Now you can see a neat and tidy column graph which shows the sales amount by each sales person. So, it’s the time to add the drill through option.
Add Drill Through Fields
If we go back to the Initial page and see the used fields on the line graph, we will find Year and Month Name. So, these two fields are the ones which should be used for drill through. You can use any field or category for the drill through, if you use them on one of your visuals. Here we only have Year and Month Name and we will use them.
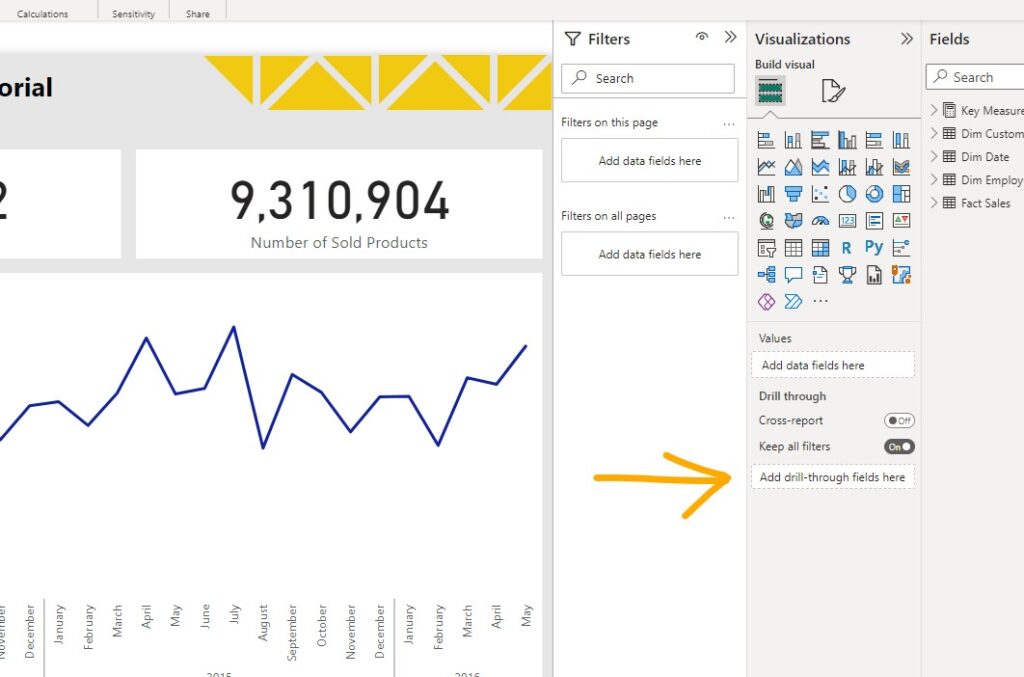
Now, we go back to the Sales Person page, and at the bottom of the visualisation pane we can see Drill Through field.
Just drag and drop Year and Month Name from Dim Date Table into this field. EASY!
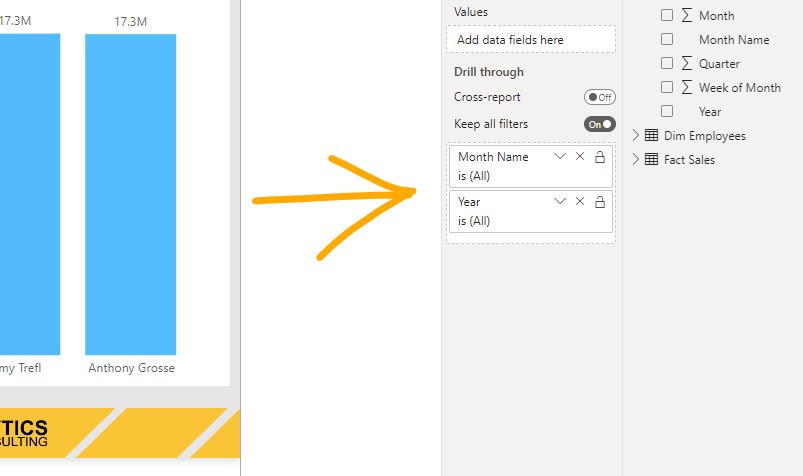
When you add any column to the Drill Through field, on top left a back button will be created automatically for you. I just drag it to the position I like, add a text value to it, and format it.
Test
To test, right click on each point of the time on your line graph in the initial page, and there, you can see the Drill Through option. For example here I right click on September 2014 for further details.

If you hover your mouse on Drill Through, the name of pages that you’ve set drill through will be appeared! Here you can see Sales Person.
Click on the Sales Person, and boom!
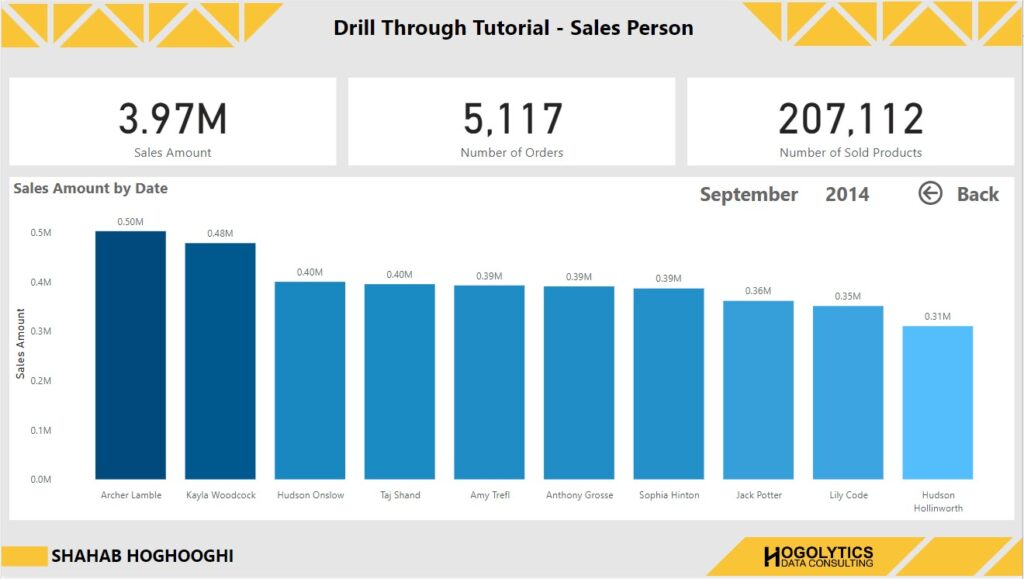
This page shows you the detailed information about the performance of your sales persons. And as you can see, the cards info shows this data is related to September 2014.
Now to go back to the previous page, you can easily click on the Back button and go back to the last page.
The same, you can create another pages, like customers, and in the new pages, under visualisation pane, add the required fields to the drill through field area. This helps you to navigate between different visuals and see the details behind them.
This time if your manager asked for more details about the data behind your visuals, don’t worry. Easily use Drill Through and act like a super hero!
Final Word
Hope you enjoyed this article. Please read all articles on this blog to become a master in Power BI. You can also watch YouTube channel videos to learn in depth.
Please ask your questions in the comment section or below the related video on YouTube channel.